Ginger Wang
Graduate Business Analyst | Project Management |
Coordinator | Problem Solver

Supercar Twitter and TV Viewship Analysis
Marketing analysis through Twitter and TV Viewership data to explore insight. The content of live eWOM communications taking place on social media during
the live content broadcast and discover more on online user engagement and live television viewership. Methods being used: Feature Engineering, Sentiment Analysis, and Topic Modelling. At the end of the report, it provided recommendations based on the result.
Define the Question & Data Processing
Exploratory Data Analysis
Basic EDA shows that event 11 is a hotspot with a larger number of tweets compared to other events. Also, Sunday is when the majority of people gather on Twitter and post tweets. For TV viewership, events 11, 1, 12, 14, and 10 had more than 10 thousand views. Similar to tweets, more people watched the event on Sunday. The peak time for TV ratings is from 15.45 to 17.45, whereas there were only a few viewers from 7.00 – 9.00 and 19.00 – 20.30. This indicates that people prefer to watch the competition in the later afternoon on weekends.

Word Cloud of Tweets
The word cloud of all tweets shows the host city names and names of Supercars championships (e.g. Bathurst 1000, v8sc, Adelaide) are frequently mentioned words. Since we are not focused on predicting the event or city that received the most attention, these words are deleted before topic modelling.
Feature Engineering
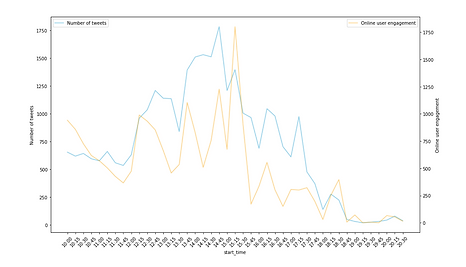
Feature engineering and investigation of the relationship between variables are done in this stage. First, we defined engagement as the sum of retweets, likes, and comments. The average engagement is roughly 1 and one of the most discussed tweets receives 577 engagements. Then, we merged tweets and the TV rating dataset (which were already grouped by time, event, and days) using the tweets time plus 15 minutes and the actual TV viewership time. This report used delayed tweets time because we assume that it took 15 minutes for the tweets to have an effect on TV viewership if there is any effect. Figure 2 indicates there is a high positive relationship between the number of tweets and engagement. From the perspective of time, there is roughly a 15-minutes time delay in the engagement. A similar distribution pattern can be seen from the number of tweets and the number of TV viewers in figure 3. Yet the peak time for people to post tweets is in the early afternoon, while more people watched TV in the later afternoon.
Correlation Coefficient of TV viewership and engagement
The linear correlation analysis shows that TV has slightly positive correlations between weekdays, events, the number of tweets, and engagement variables. While those variables also affect online engagement, the correlation with the number of tweets is significantly higher.


Sentiment Analysis
In order to map the relationship between tweets’ sentiment score and TV viewership or engagement, we first obtained the score for all tweets in the dataset using the VADER package in Python. There are four scores produced by this package: positive, neutral, negative, and compound, which is the total of the other 3 scores combined. As we want to know which sentiment has the strongest effect on the response variables, we used positive, neutral, and negative scores. To link the tweets’ sentiment with TV viewership, we grouped the tweets based on time intervals of TV viewership data, and then took the average scores of all tweets in the same groups.
Next, the tweets’ sentiment scores were modelled to predict the number of TV viewers or engagement using 5 machine learning models: Linear Regression, KNN with k equal to 3 and 5, XGBoost, and Random Forest. The relationship between sentiment score and TV viewership or user engagement was analysed using several prediction accuracy metrics. If the relationship exists, then one best-performing model was chosen using the same metrics. Last, we interpret the direction of the relationship between the features and response variables.
Sentiment analysis and TV viewership
The machine learning models, when used to predict the number of TV viewership using the sentiment analysis score, yielded poor prediction metrics. The R2 for XGBoost is only 0.3085 which means only 30% of the variance in TV viewership can be explained by the sentiment analysis score.

Sentiment analysis and engagement
In contrast with the TV viewership, sentiment analysis can be used to predict engagement. All models have good prediction scores except for Linear Regression which imply that the relationship between sentiment score and user engagement is non-linear. The best performing model is KNN (k = 3) that can explain 98.42% of the variance in engagement data.

When trying to identify the effect of each of the sentiment scores on engagement, we cannot use KNN due to its lack of interpretability. Therefore, we use the feature importance of the second-best performing model, Random Forest, which shows that positive sentiment has the strongest effect on user engagement, followed by a negative score.
Feature Importance
As there are only three features, the feature importance values might not be too different from each other. However, the importance scores do not tell us the direction of the relationship, hence, we use SHAP values for this purpose (Becker & Cook n.d.). Based on the SHAP plot, high positive scores (marked by the red dots) resulted in higher prediction for engagement, while the low positive score (marked by the blue dots) brought the prediction lower. As for negative scores, low negative scores led to both low and high user engagement predictions. Whereas the majority of the high negative score has no effect on user engagement.

Topic Modeling
Topic modelling is important for text mining and natural language processing. Asur and Huberman (2010) suggested that using models to aggregate tweets and suggestions from people on Twitter or other social media and predict future trends can help companies to design marketing campaigns or advertising campaigns. The results may be better than quantitative predictions from artificial markets. Jelodar et al. (2018) also suggested that using topic models to analyse people's reactions and conversations posted on social media about events can help extract useful patterns to understand the text contents.
In this report, the analysis is performed using Latent Dirichlet Allocation (LDA), which is the most common method for topic modelling. LDA is an unsupervised learning technique that can be used to identify hidden topic information in a large document or corpus. We identified what topics fans and viewers discussed during the event and then analysed which topics resulted in high engagement and TV viewership.
Topic modelling and Engagement
In analysing the relationship between tweets topic and engagement, we separated the data into two according to the number of engagements: more than zero and equals zero. We set the number of topics to 10, and the three topics with the highest probabilities were selected for analysis. For engagement, more than zero, topic 4, topic 2 and topic 6 are the most discussed topics. The topic map shows that the most relevant terms for those topics’ words can be divided into three groups. First, the positive words that indicate the user's emotion and feeling, such as ‘great’, ‘amazing’, and ‘incredible’. Second, the names of racing drivers, such as Nick Percat, Jamie Whincup, Morris, Oliver Gavin and Gisbergen, were mentioned and received more attention and discussion during the race. The third group is words related to cars like the cars brands: Ford and Holden. The sentiment scores of these three topics are 0.025, 0.013 and 0.011 respectively.


To further support the analysis of the results, we selected the top five tweets with the highest probabilities in topic4. The first, second and fifth tweets show that Twitter users pay more attention to the drivers who have outstanding performance in the race.
Topic modelling and TV viewership
ne study mentioned that 41% of users like to discuss their favourite shows on Twitter, thus forming discussions on Twitter. This suggests that there is a connection between TV viewership and tweets. We analysed the tweets’ topics of ten time periods with the highest TV ratings as per EDA sections. Based on the result, we made a hypothesis about the topics that influence TV ratings.
In this part, the number of topics was set to 5 as it produced better topics than when the number of topics was set to 10. The topic that was most discussed during the peak hours is topic 1. This topic represents people’s love to the race with words like ‘Amp’, ‘supercar’, ‘love’, and ‘great’ frequently used. Furthermore, the drivers that were mostly discussed at these times were Winston and Murah. Therefore, we speculated that they generated public attention more than other drivers.


Recommendations
Our analysis showed that tweets’ sentiment and topics affect engagement, but have a weak relationship with TV viewership. We have listed several recommendations based on our findings:

1
Based on EDA, Sunday has the highest engagement and number of tweets. Hence, if Supercars would like to reach higher exposure and engagement, they should be tweeting on Sunday. Similarly, the peak time for TV is from 15.00 – 17.00 on Sunday, which indicates the best timing to invest in a traditional TV advertisement, should Supercars wish to have one. Timing is critical to marketing, if the campaign is posted or promoted at the correct time, it will reach the correct target audience with higher awareness and more response (Sarah, 2018).
2
There is no significant relationship between engagement and TV viewership. Therefore, the marketing activities to increase TV ratings should not depend on engagement.
3
Positive tweets led to more engagement than neutral or negative tweets. We suggest Supercars’ social media team control and ensure people tweeted positive things about Supercars, and counteract negative tweets with positive sentiments.
4
Topic modelling shows that drivers were frequently discussed in tweets with engagement more than zero, and at the TV peak time. Thus, we suggest Supercars to not only promote the team but also the drivers. For example, posting more content about drivers, preparing personal interviews, videos, pictures, behind the scene recording to trigger the audience’s interest. Hopefully, the number of viewership and engagement will increase and will lead to increase in revenue.
Limitations
There are several limitations to our study. First, we only use three variables of sentiment analysis which resulted in small differences between each variable’s importance. Future studies can expand them to emotional sentiment as one study by Seiler (2017, as cited in Segjin 2019) stated that the emotions of the tweet affect its engagement. Second, we did not tune the number of topics in topic modelling. Whereas we can use the goodness-of-fit to choose the topic number (Mathworks, n.d.).
From the bigger perspective, the real relationship between tweets for Supercars and TV viewership is unknown. We can only infer what happened at the TV peak time through tweets at that time, however, there is a chance that the discussion on Twitter is different from what is playing on TV. Moreover, we do not know the real-time delay between TV viewership numbers and tweets by viewers. In this analysis, we choose 15 minutes delay.